Benefits of State Clean Energy Mandates Outweigh Costs, Federal Report Finds
The costs associated with implementing state renewable-energy standards between now and mid-century will be far outweighed by the benefits to public health and the environment, a new federal report finds.
The report was released jointly by the Lawrence Berkeley National Laboratory and the National Renewable Energy Laboratory, and is the third in a series of federal studies assessing state clean-energy policies.
Currently, 29 states and the District of Columbia have Renewable Portfolio Standards (RPS), which require utilities to derive an increasing share of power from clean-energy sources over time.
These policies have been a key driver for the growth of non-fossil-fuel generation, and have been responsible for more than half of all renewable capacity additions since 2000, according to the study. (Other drivers include federal tax credits and other state policies.)
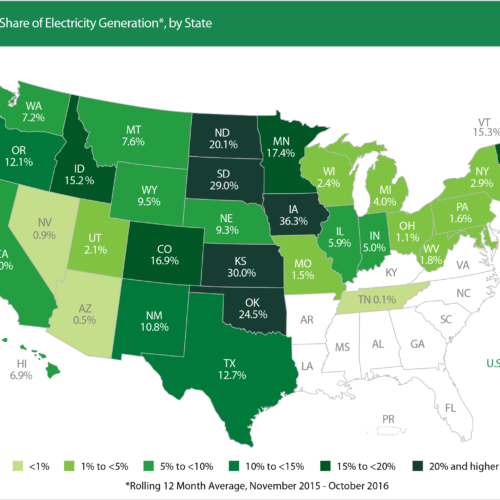
Electricity from solar, wind, hydroelectric power and other renewable sources comprised about 14% of U.S. electricity generation in 2015. As the policies currently stand, most states are expected to reach their maximum targets for renewable generation between 2020 and 2025, though eight states have targets that increase until 2030 or beyond.
In recent years, many states have raised their RPS requirements, with seven states raising and extending them in 2015 and 2016 alone, and one state—Vermont—enacting a new RPS. There have also been efforts in a number of states to repeal or freeze existing RPS policies. In late December, Ohio Gov. John Kasich vetoed legislation that would have effectively extended a freeze on that state’s RPS that had been in effect for two years.
The report notes that officials in some states will likely look to expand and strengthen state RPS programs in the coming years, while efforts to repeal or freeze existing policies may persist in other states.
Quantifying Future Benefits
The new analysis seeks answers to two questions not covered by the previous reports: What are the potential future costs, benefits, and impacts of renewables used to meet state RPS programs from 2015-2050, as they are currently structured? And, how would the costs and benefits change with greater levels of renewable deployment?
The study considers two different scenarios: an “existing RPS” scenario, in which renewable energy requirements continue to grow based on current state RPS policies as of July 2016; and a “high RPS” scenario, in which most states adopt relatively aggressive targets in the coming years. Those two scenarios are measured against a hypothetical baseline which assumes no further growth in RPS requirements beyond 2015.
Under the “existing RPS” analysis, renewables will account for 26% of total U.S. electricity generation by 2030 and 40% by 2050, compared with the baseline scenario of 21% by 2030 and 34% by 2050.
In the “high RPS” analysis, renewables reach 35% of total electricity generation by 2030 and 49% by 2050.
In both the “existing RPS” and “high RPS” scenarios, fossil-fuel generation declines, compared with the baseline. This leads to lower quantities of sulfur dioxide, nitrogen oxides and fine particulates spewing from smokestacks, which in turn improves air quality and avoids premature deaths from pollution. Less fossil-fuel generation also lowers greenhouse-gas emissions and reduces electricity-sector water use.
The researchers estimate that the monetary benefits associated with these public health and environmental improvements will exceed the costs of greater penetration of renewable generation in the nation’s electricity system, “even when considering the highest cost and lowest benefit outcomes.”
For example, in the “existing RPS” scenario, incremental electricity-system costs range from plus or minus $31 billion during 2015-2050, while the air-quality benefit is estimated at $97 billion. During that same period, life-cycle greenhouse gas emissions fall by 6%, which lead to $160 billion in global benefits.
This translates to a levelized, high-end cost of 0.75¢ per kilowatt-hour of electricity, which is outweighed by air pollution and health benefits of at least 1.2¢ per kilowatt-hour, and greenhouse-gas-reduction benefits totaling at least 0.9¢ per kilowatt-hour.
For the “high” renewable energy scenario, estimated incremental electricity-system costs range from $23 billion to $194 billion from 2015-2050, while air-quality benefits are estimated at $558 billion. Cumulative life-cycle greenhouse-gas emissions decrease by 23%, resulting in $599 billion of global benefits.
This translates to a levelized, high-end electricity cost of 1.5¢ per kilowatt-hour, compared with air pollution and health benefits totaling at least 2.7¢ per kilowatt-hour, and greenhouse-gas-reduction benefits of at least 1.2¢ per kilowatt-hour.
Compared with the baseline scenario, water consumption falls in both analyses. By 2030, annual water consumption savings are equal to the water demands of 420,000 U.S. households under the “existing RPS” scenario, and to those of 1.9 million households in the “high RPS” scenario.
Both scenarios lead to more jobs in the renewable-energy sector and to a drop in demand for natural gas, though the study considers those impacts to be resource transfers rather than societal benefits – explaining, for example, that the rise in jobs will be offset by a decrease in employment in other economic sectors.
The authors mention a number of caveats and limitations in the scope of the study, which does not take into account recent changes in state renewable-energy policies since late summer. The analysis was completed before New York officials increased the state’s RPS last August to 50% by 2030, up from 29% by 2015, and prior to a vote among Michigan lawmakers last month to approve legislation expanding that state’s RPS to 35% by 2025. The report also notes that aside from state mandates, a variety of other policy and market forces may contribute to renewable-energy growth over the study’s horizon, and to the associated benefits.
You can read a fact sheet that details the report’s findings here.